Current Conditions
♦
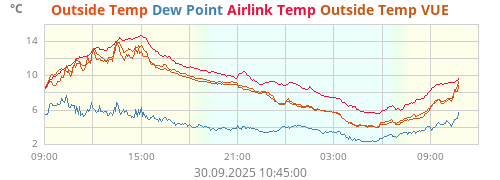
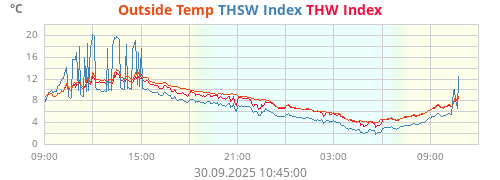
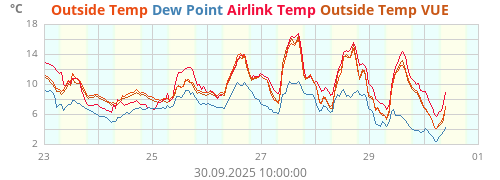
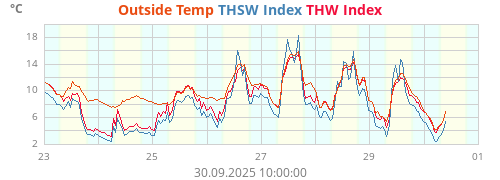
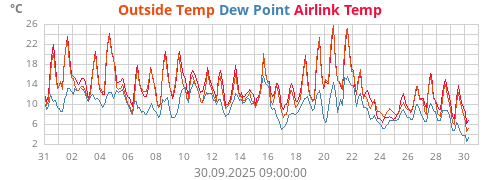
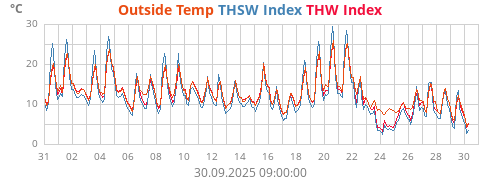
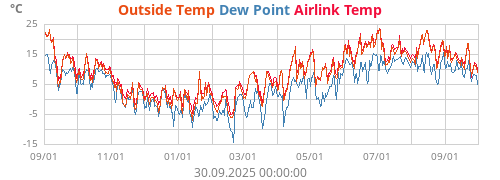
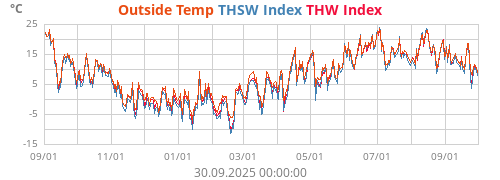
| Outside Temp | 12,6°C (∆ 4,3°C) |
| Outside Temp ø | 12,35°C |
| Outside Temp ø yesterday | 13,60°C |
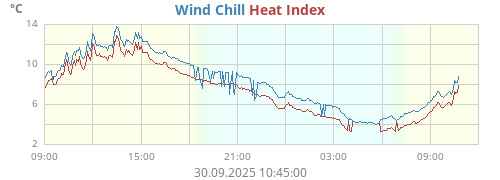
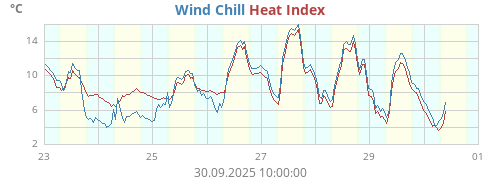
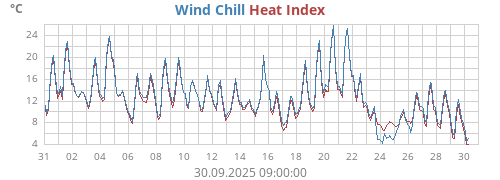
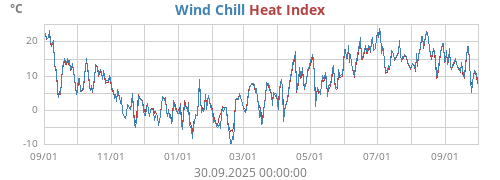
| Heat Index | 12,4°C |
| Wind Chill | 12,6°C |
| Dew Point | 7,5°C |
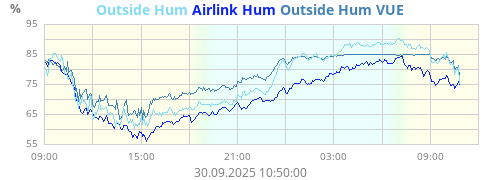
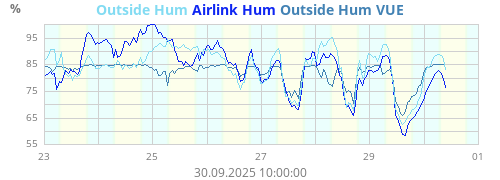
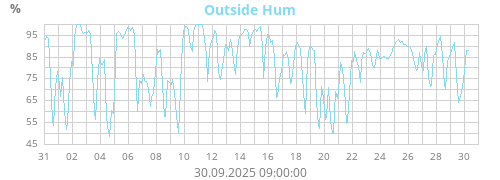
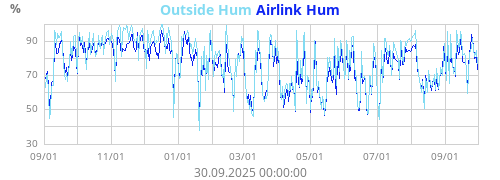
| Outside Hum | 94% |
| Apparent Temperature | 13,1°C |
| Humidex | 14,7°C |
| Outside Wetbulb | 12,1°C |
| THSW Index | 11,2°C |
| THW Index | 12,8°C |
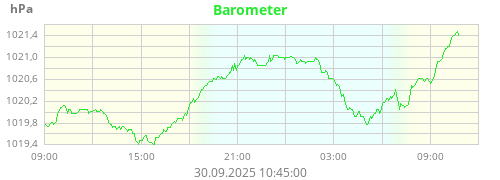
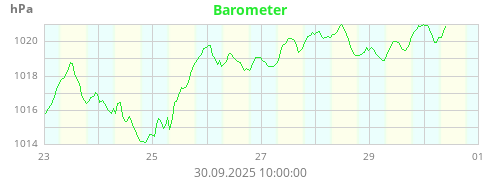
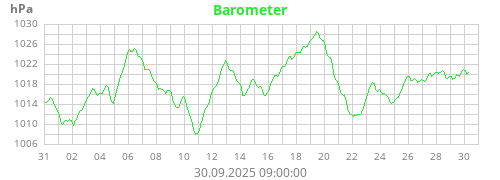
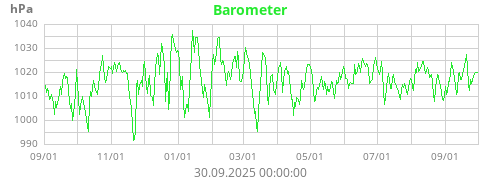
| Barometer | 1018,7 hPa (∆ -0,6) |
| Pressure | 922,7 hPa (∆ -0,6) |
| Cloud Base | 943 meters |
| Heating Degree Day (18°C) | 0,228 °C-day |
| Heating Degree Day WeeWx | 6,0°C-day |
| Heating Degree Day WeeWx | 10,8°F-day |
| Heating Degree Day (65°F) | 1,010 °F-day |
| - - - - - - - - - - - - - - - - - - - - - | |
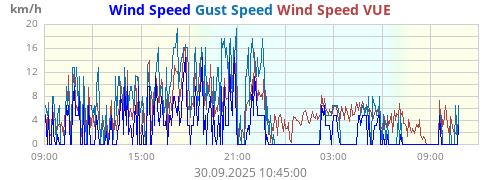
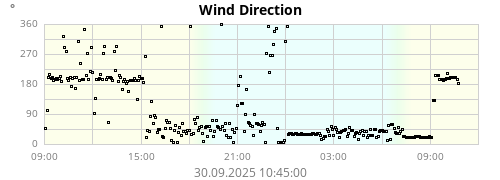
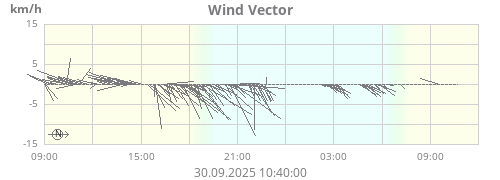
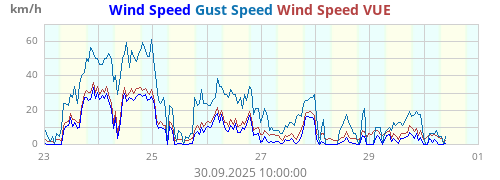
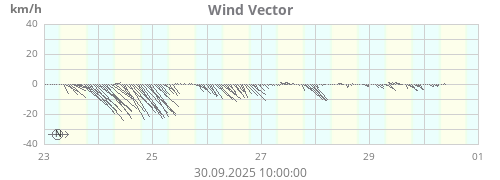
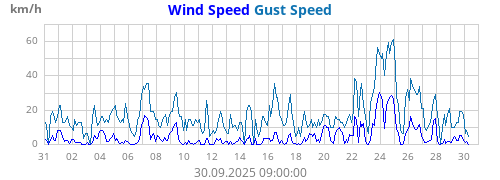
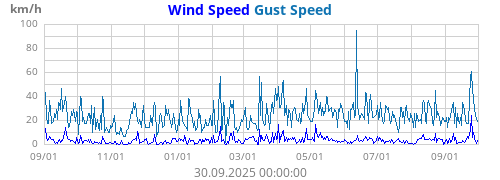
| Wind Speed | 0,0 km/h NNE (24°) |
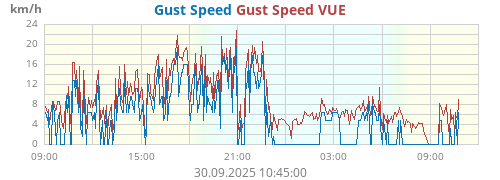
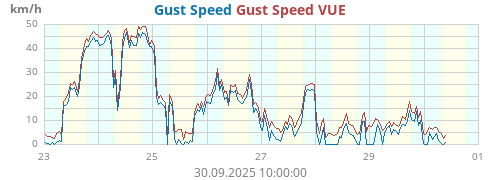
| Gust Speed | 0,0 km/h NNE (19°) |
| Windspeed last 1 min | 0,0 km/h |
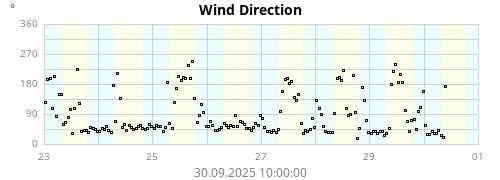
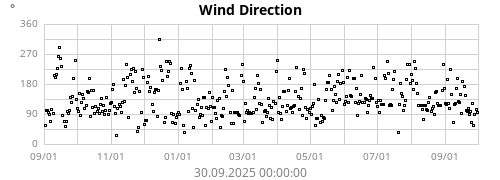
| Wind Dir last 1 min | 0° |
| Windspeed last 10 min | 0,0 km/h |
| Wind Dir last 10 min | 0° |
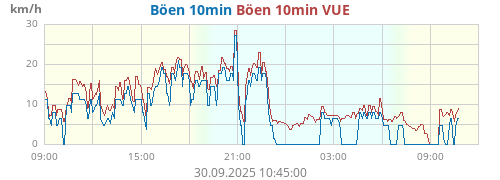
| Wind Gust last 10 min | 0,0 km/h |
| Wind Gust Dir last 10 min | 40° |
| Wind Run | 1,9 km |
| - - - - - - - - - - - - - - - - - - - - - | |
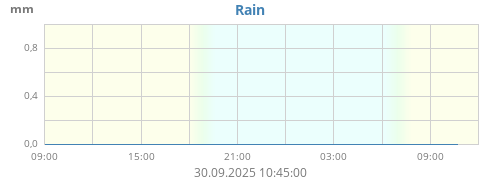
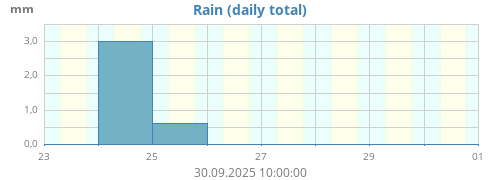
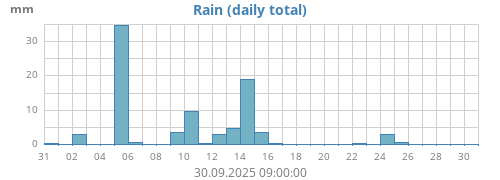
| Rain | 0,0 mm |
| Rain Day | 0,6 mm |
| Rain Rate | 0,0mm/h |
| Precipitation Storm | 0,6 mm |
| Rain Storm last | 66,8 mm |
| Rain last 15 min | 0,0 mm |
| Rain last 60 min | 0,4 mm |
| Hi Rain Rate last 15 min | 0,0 mm |
| Current Rain Storm start | 17.06.2026 00:58:55 |
| Rain Storm start | 09.06.2026 15:19:54 |
| Rain Storm end | 14.06.2026 05:08:05 |
| Precipitation Day | 0,6 mm |
| Rain last 24 hr | 0,6 mm |
| Precipitation Month | 118,2 mm |
| Precipitation Year | 402,6 mm |
| Rain duration | 0:15:00 hrs. |
| Evapotranspiration | 0,0 mm |
| Day Evapotranspiration | 0,0 mm |
| 24 hrs. Evapotranspiration | 4,4 mm |
| Month Evapotranspiration | 52,5 mm |
| Year Evapotranspiration | 342,4 mm |
| - - - - - - - - - - - - - - - - - - - - - | |
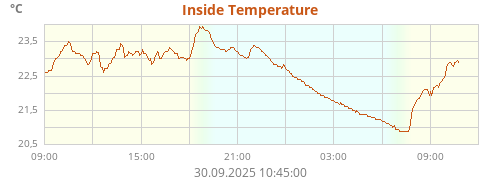
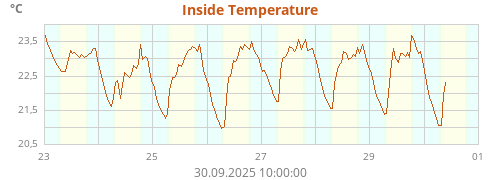
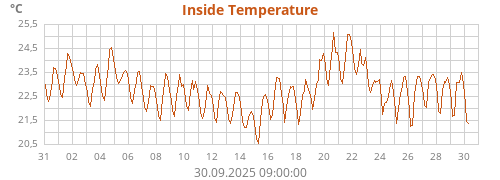
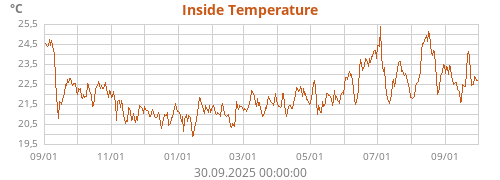
| Inside Temperature | 21,2°C |
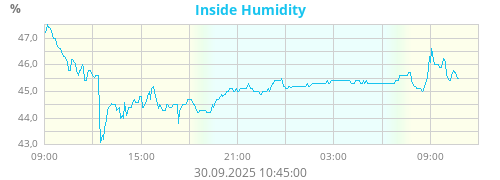
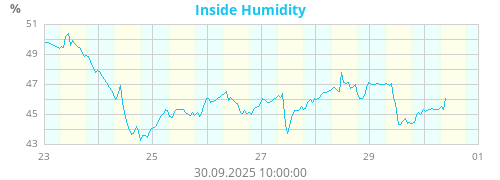
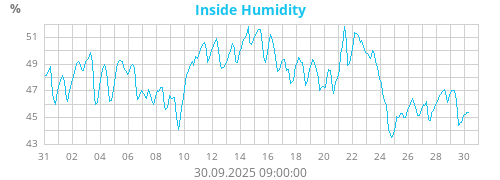
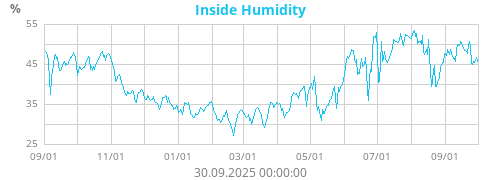
| Inside Humidity | 47% |
| Inside Dew Point | 9,3°C |
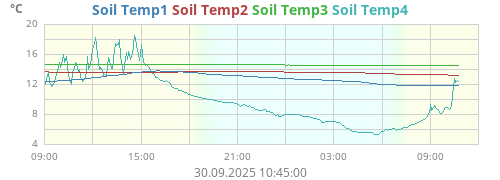
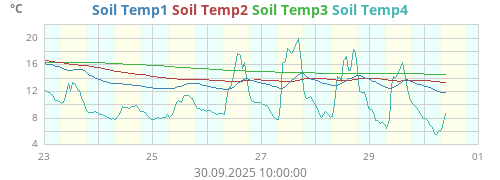
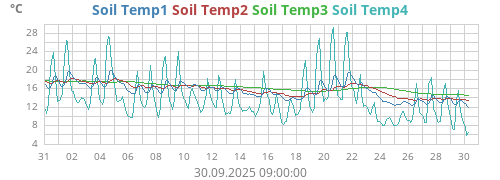
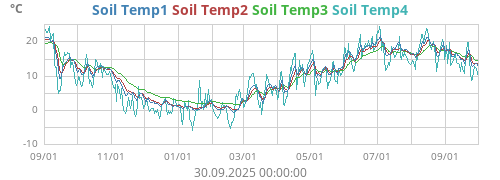
| Soil Temp1 | 15,0°C |
| Soil Temp2 | 14,7°C |
| Soil Temp3 | 14,2°C |
| Soil Temp4 | 12,0°C |
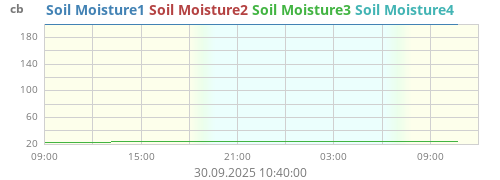
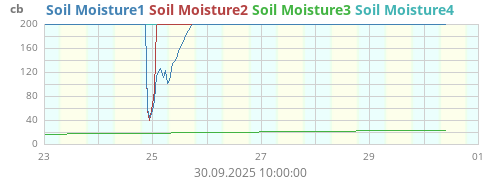
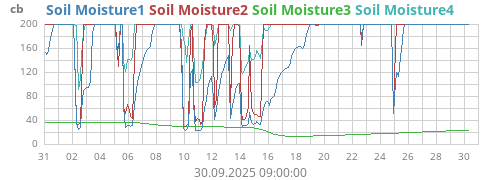
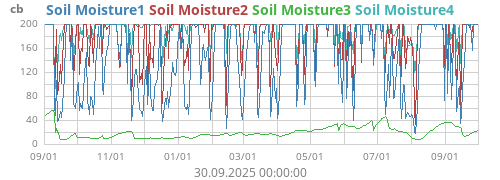
| Soil Moisture1 | 62 cb |
| Soil Moisture2 | 55 cb |
| Soil Moisture3 | 10 cb |
| Soil Moisture4 | 200 cb |
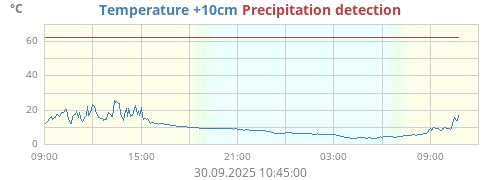
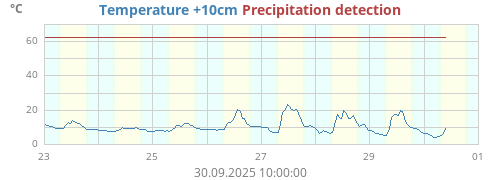
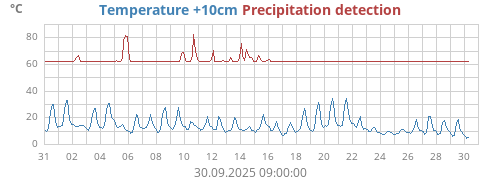
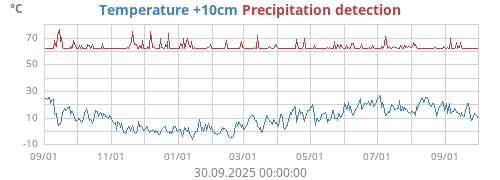
| Temperature +10cm | 12,0°C |
| Precipitation detection | 62,3°C |
| Leaf Wetness1 | 15 |
| Leaf Wetness2 | 15 |
| - - - - - - - - - - - - - - - - - - - - - | |
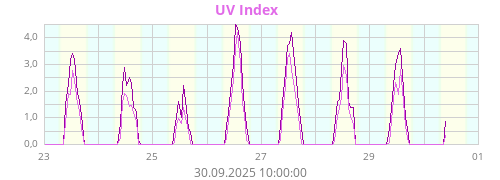
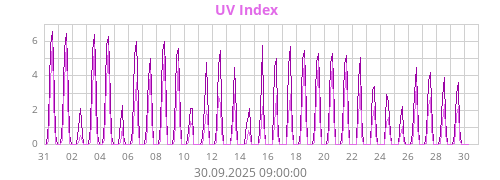
| UV Index | 0,0 |
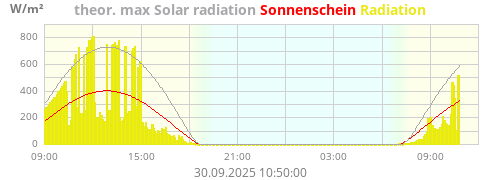
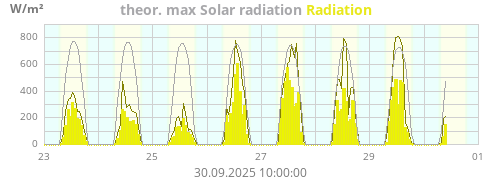
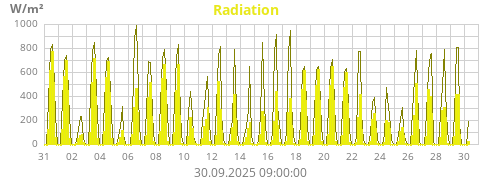
| Radiation | 0 W/m² |
| theor. max Solar radiation | 0 W/m² |
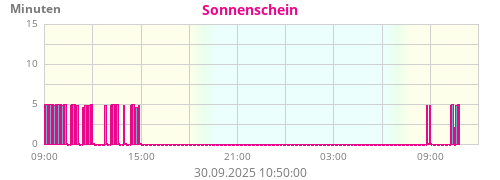
| Sunshine time | 0 W/m² |
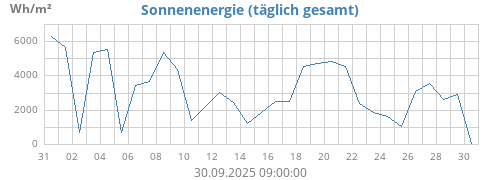
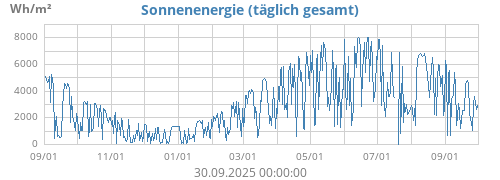
| Energy Integral yesterday | 4,839 kWh/m² |
| Energy Integral today | 0,000 kWh/m² |
| Solar time 120W/m² | 0:00 hrs. |
| Sunshine duration | 0:00:00 hrs. |
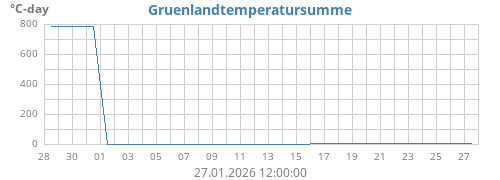
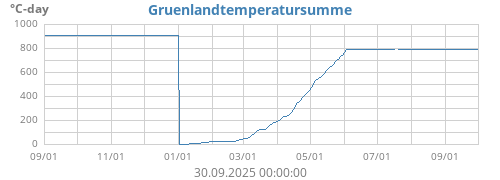
| Grassland temperature | 810,2°C-day |
| Grassland temp 200 | 04.04.2026 |
| - - - - - - - - - - - - - - - - - - - - - | |
| Data Airlink | |
| Airlink Temp | 13,7°C |
| Airlink Hum | 90% |
| Airlink Dew Point | 12,1°C |
| Airlink Heat Index | 13,8°C |
| Airlink Wetbulb | 12,7°C |
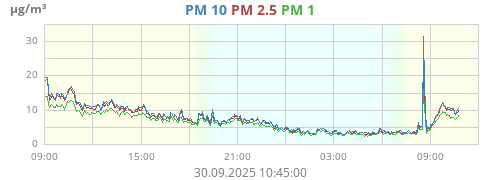
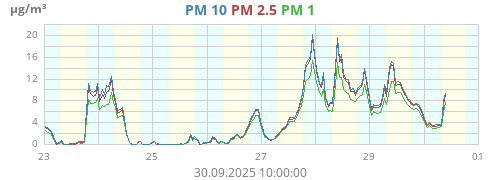
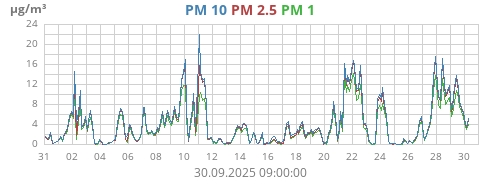
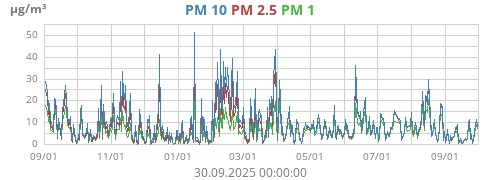
| PM 1 | 3,2 µg/m³ |
| PM 2.5 | 3,7 µg/m³ |
| PM 2.5 | 15 AQI EPA |
| PM 2.5 | 0.36 AQI EEA |
| PM 2.5 nowcast | 3,7 µg/m³ |
| PM 2.5 last 1 hr | 3,9 µg/m³ |
| PM 2.5 last 3 hrs | 3,4 µg/m³ |
| PM 2.5 last 24 hrs | 5,1 µg/m³ |
| PM 10 | 4,0 µg/m³ |
| PM 10 nowcast | 4,6 µg/m³ |
| PM 10 last 1 hr | 4,9 µg/m³ |
| PM 10 last 3 hrs | 4,3 µg/m³ |
| PM 10 last 24 hrs | 5,6 µg/m³ |
| PCT PM Data last 1 hr | 100% |
| PCT PM Data last 3 hrs | 100% |
| PCT PM Data last 24 hrs | 100% |
| - - - - - - - - - - - - - - - - - - - - - | |
| Data VUE | |
| Outside Temp VUE | 11,9°C |
| Outside Hum VUE | 74% |
| Heat Index VUE | 11,6°C |
| Wind Chill VUE | 11,9°C |
| Apparent Temperature VUE | 11,3°C |
| Humidex VUE | 12,1°C |
| Wetbulb VUE | 9,5°C |
| THW Index VUE | 11,6°C |
| Heating Degree Day (18°C) VUE | 0,263 °C-day |
| Wind Speed VUE | 0,0 km/h |
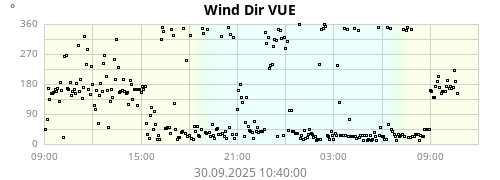
| Wind Dir VUE | 11° |
| Gust Speed VUE | 0,0 km/h |
| Gust Dir VUE | 344° |
| Wind Run VUE | 0,0 km |
| Wind Gust last 10 min VUE | 0,0 km/h |
| Wind Gust Dir last 10 min VUE | 24° |
| Rain VUE | 0,0 mm |
| Rain Rate VUE | 0,0mm/h |
| Rain last 15 min VUE | 0,0 mm |
| Rain last 60 min VUE | 0,6 mm |
| Storm Rain VUE | 1,0 mm |
| Storm Rain last VUE | 67,2 mm |
| Hi Rain Rate last 15 min VUE | 0,0 mm |
| Current Rain Storm start VUE | 17.06.2026 00:57:08 |
| Rain Storm start VUE | 09.06.2026 15:18:30 |
| Rain Storm end VUE | 14.06.2026 04:52:01 |
| Day Rain VUE | 1,0 mm |
| Rain duration VUE | 0:25:00 hrs. |
| Rain last 24 hr VUE | 1,0 mm |
| Month Rain VUE | 118,6 mm |
| Year Rain VUE | 369,6 mm |
| - - - - - - - - - - - - - - - - - - - - - | |
| Data other | |
| Current vapor pressure | 13,7 hPa |
| Saturation vapor pressure | 14,6 hPa |
| Mixing Ratio | 9,4 g/kg |
| Equivalent temperature | 34,8°C |
| potent. Equivalent temperature | 42,0°C |
| abs. Humidity | 10,4 g/m³ |
| Boiling Temp. of the Water | 97,3°C |
| ☀ | ☽ | |||
|---|---|---|---|---|
| Rise | 05:00:37 | Rise | 07:15:32 | |
| Set | 21:10:47 | Set | 23:38:17 | |
| Daylight | 16:10 | Waxing crescent 6% |
| Today |
Week |
Month |
Year |
Alltime |
||
|---|---|---|---|---|---|---|
| Outside Temp |
02:00:04
12,7 00:10:11 11,9 |
14:35:07 (Dienstag)
18,8 04:35:10 (Montag) 6,2 |
08.06.2026 15:30:12
24,1 11.06.2026 22:55:00 5,3 |
26.05.2026 14:10:07
28,0 23.01.2026 04:25:11 -14,4 |
02.07.2025 13:50:00
31,1 23.01.2026 04:25:11 -14,4 |
°C |
| Heat Index |
02:00:04
12,4 00:10:11 11,5 |
14:35:07 (Dienstag)
18,3 04:35:10 (Montag) 5,2 |
08.06.2026 15:30:12
23,6 11.06.2026 22:50:09 4,4 |
26.05.2026 14:10:07
27,6 23.01.2026 04:25:11 -14,4 |
13.08.2024 17:10:00
31,2 23.01.2026 04:25:11 -14,4 |
°C |
| Wind Chill |
02:00:04
12,7 00:10:11 11,9 |
14:35:07 (Dienstag)
18,8 04:40:11 (Montag) 5,0 |
08.06.2026 15:30:12
24,1 11.06.2026 17:37:43 3,1 |
26.05.2026 14:10:07
28,0 11.01.2026 20:10:05 -18,2 |
02.07.2025 13:50:00
31,1 08.01.2024 22:40:00 -18,7 |
°C |
| Dew Point |
00:50:03
8,8 02:15:08 7,5 |
17:15:06 (Dienstag)
12,5 04:35:10 (Montag) 2,9 |
08.06.2026 19:20:10
14,6 12.06.2026 00:20:06 0,3 |
25.05.2026 18:05:04
17,7 21.01.2026 21:20:09 -73,3 |
10.07.2024 11:35:00
21,2 21.01.2026 21:20:09 -73,3 |
°C |
| Outside Hum |
02:00:04
94 00:05:00 89 |
02:00:04 (Mittwoch)
94 17:20:05 (Montag) 47 |
12.06.2026 18:00:09
100 08.06.2026 12:10:03 38 |
13.01.2026 01:20:10
100 21.01.2026 21:20:09 0 |
25.10.2023 00:35:00
100 28.12.2025 01:55:05 0 |
% |
| Barometer |
00:00:08
1019,4 01:55:00 1018,5 |
21:40:07 (Dienstag)
1019,7 04:00:09 (Montag) 1013,6 |
07.06.2026 13:05:10
1023,8 02.06.2026 21:55:03 1006,9 |
25.05.2026 10:55:08
1031,9 12.02.2026 13:40:06 980,8 |
13.01.2025 14:10:00
1038,8 05.11.2023 05:55:00 979,5 |
hPa |
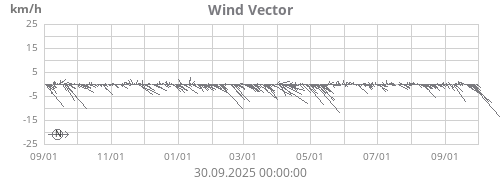
| Wind Speed |
00:25:00
4,8 00:00:08 0,0 |
13:10:00 (Montag)
24,1 00:00:09 (Montag) 0,0 |
13.06.2026 15:25:00
32,2 01.06.2026 00:00:03 0,0 |
15.02.2026 00:10:00
41,8 01.01.2026 00:00:08 0,0 |
24.12.2025 12:25:00
57,9 09.10.2023 19:15:25 0,0 |
km/h |
| Average Wind |
0,8 NE 48 |
3,4 SSE 162 |
2,8 S 169 |
3,9 SE 140 |
3,4 SE 142 | km/h |
| RMS Wind | 1,9 | 5,3 | 4,8 | 6,4 | 6,0 | km/h |
|
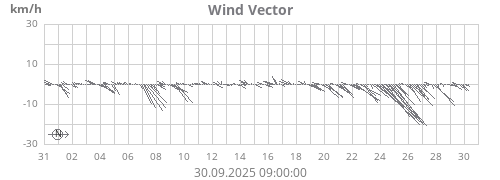
Vector Average Vector Direction |
0,8 NE 41 |
1,0 NW 306 |
0,5 WNW 301 |
2,1 NE 34 |
1,8 NE 34 |
km/h ° |
| Gust Speed |
00:45:11
8,0 00:05:10 0,0 |
13:47:44 (Montag)
41,8 00:50:04 (Montag) 0,0 |
13.06.2026 15:10:12
45,1 01.06.2026 01:35:11 0,0 |
19.02.2026 15:20:12
56,3 01.01.2026 11:55:13 0,0 |
11.06.2025 08:20:00
95,0 09.10.2023 19:15:25 0,0 |
km/h |
| Max Wind |
8,0 NNE 22 |
41,8 S 180 |
45,1 SSW 192 |
56,3 ENE 72 |
95,0 S 186 |
km/h ° |
| Wind Run | 1,9 | 170,3 | 1090,0 | 15553,2 | 78447,1 | km |
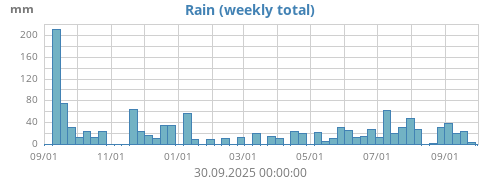
| Rain | 0,6 | 0,6 | 117,6 | 401,6 | 3100,6 | mm |
| Rain Rate | 01:40:08 0,8 | 01:40:08 (Mittwoch) 0,8 | 11.06.2026 17:20:08 34,4 | 11.06.2026 17:20:08 34,4 | 26.06.2025 20:40:00 144,0 | mm/h |
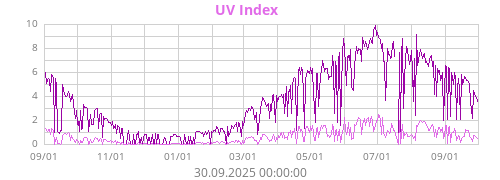
| UV Index | 00:00:08 0,0 | 13:05:12 (Montag) 7,2 | 13.06.2026 13:10:06 8,8 | 13.06.2026 13:10:06 8,8 | 28.06.2025 13:05:00 9,9 | |
| Evapotranspiration | 0,0 | 9,3 | 53,4 | 347,2 | 1882,8 | mm |
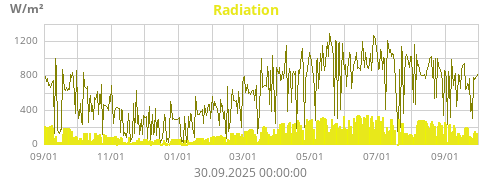
| Radiation | 00:00:08 0 | 13:05:12 (Montag) 1148 | 11.06.2026 11:47:50 1266 | 11.06.2026 11:47:50 1266 | 18.05.2025 14:15:00 1290 | W/m² |
| theor. max Solar radiation | 00:00:08 0 | 13:05:10 (Dienstag) 1077 | 16.06.2026 13:05:10 1077 | 16.06.2026 13:05:10 1077 | 18.06.2025 13:10:00 1077 | W/m² |
| Sunshine time | 00:05:00 0 | 13:05:00 (Montag) 591 | 15.06.2026 13:05:00 591 | 15.06.2026 13:05:00 591 | 14.06.2024 13:05:00 611 | W/m² |
| Airlink Temp |
02:05:00
13,9 00:27:46 13,2 |
14:27:45 (Dienstag)
20,3 04:42:52 (Montag) 7,7 |
08.06.2026 16:07:52
24,7 12.06.2026 02:12:50 6,4 |
26.05.2026 14:07:46
27,7 08.01.2026 01:32:44 -11,4 |
02.07.2025 15:35:00
31,0 08.01.2026 01:32:44 -11,4 |
°C |
| Airlink Hum |
02:07:46
91 00:07:50 84 |
02:07:46 (Mittwoch)
91 17:32:48 (Montag) 46 |
12.06.2026 23:57:44
99 08.06.2026 11:52:48 40 |
02.01.2026 11:37:49
100 19.01.2026 11:52:52 19 |
19.11.2023 14:40:00
100 27.12.2024 11:45:00 19 |
% |
| PM 1 |
01:52:51
3,7 00:02:49 1,2 |
14:27:45 (Dienstag)
8,1 00:02:49 (Mittwoch) 1,2 |
13.06.2026 08:37:45
18,1 03.06.2026 06:47:52 0,0 |
25.02.2026 19:17:50
140,2 02.01.2026 12:47:44 0,0 |
09.01.2024 17:10:00
999,0 15.11.2023 20:25:00 0,0 |
µg/m³ |
| PM 2.5 |
01:52:51
5,0 00:02:49 2,0 |
10:07:49 (Dienstag)
9,0 04:42:44 (Dienstag) 1,3 |
13.06.2026 08:37:45
21,3 03.06.2026 06:47:52 0,0 |
09.01.2026 17:22:47
156,3 02.01.2026 12:47:44 0,0 |
09.01.2024 17:10:00
999,0 15.11.2023 20:25:00 0,0 |
µg/m³ |
| PM 10 |
01:52:51
6,9 02:12:47 2,7 |
17:42:44 (Dienstag)
10,2 04:42:44 (Dienstag) 1,3 |
13.06.2026 08:37:45
22,2 03.06.2026 06:47:52 0,0 |
09.01.2026 17:22:47
169,5 04.01.2026 23:52:48 0,0 |
09.01.2024 17:10:00
999,0 15.11.2023 20:25:00 0,0 |
µg/m³ |
| - - - - - - - - - - - - - - - - - - - - - | ||||||
| Additional Sensors | ||||||
| Inside Temperature |
00:00:08
22,0 02:05:05 21,2 |
17:30:00 (Montag)
22,8 06:45:11 (Dienstag) 20,1 |
01.06.2026 18:50:03
23,4 16.06.2026 06:45:11 20,1 |
27.05.2026 20:05:09
24,5 08.01.2026 06:20:10 16,2 |
03.07.2025 16:50:00
26,4 09.01.2024 07:35:00 16,1 |
°C |
| Inside Humidity |
02:15:08
47 00:00:08 46 |
06:55:00 (Montag)
47 17:05:00 (Montag) 43 |
07.06.2026 10:05:00
49 02.06.2026 17:55:12 40 |
31.05.2026 11:25:00
52 07.01.2026 16:30:11 26 |
22.07.2024 19:45:00
60 08.03.2025 14:35:00 23 |
% |
| - - - - - - - - - - - - - - - - - - - - - | ||||||
| Soil Temp1 |
00:00:08
15,2 02:10:07 15,0 |
19:00:08 (Dienstag)
15,7 06:02:47 (Montag) 13,3 |
02.06.2026 17:20:12
19,8 12.06.2026 06:15:11 11,9 |
26.05.2026 16:22:47
20,6 12.01.2026 04:50:04 -1,7 |
13.08.2024 17:20:00
24,5 12.01.2026 04:50:04 -1,7 |
°C |
| Soil Temp2 |
00:00:08
14,7 00:00:08 14,7 |
21:25:12 (Dienstag)
14,7 09:25:00 (Montag) 14,1 |
08.06.2026 23:20:11
16,9 13.06.2026 03:05:00 13,2 |
27.05.2026 20:05:09
16,9 12.01.2026 01:35:04 -0,2 |
16.08.2024 21:15:00
21,7 12.01.2026 01:35:04 -0,2 |
°C |
| Soil Temp3 |
00:00:08
14,2 00:00:08 14,2 |
10:35:08 (Dienstag)
14,2 00:05:00 (Montag) 14,1 |
10.06.2026 07:25:10
15,5 14.06.2026 01:50:09 13,9 |
10.06.2026 07:25:10
15,5 05.02.2026 06:30:08 1,2 |
17.08.2024 12:50:00
20,1 23.12.2023 15:00:00 1,1 |
°C |
| Soil Temp4 |
01:35:06
12,5 00:00:08 11,7 |
11:47:47 (Dienstag)
24,2 04:25:07 (Montag) 6,2 |
02.06.2026 14:25:10
30,6 11.06.2026 17:25:09 4,5 |
26.05.2026 14:10:07
35,4 23.01.2026 06:35:00 -13,8 |
13.08.2024 16:50:00
35,6 23.01.2026 06:35:00 -13,8 |
°C |
| Soil Moisture1 |
00:00:08
200 01:55:12 62 |
20:42:44 (Montag)
200 01:55:12 (Mittwoch) 62 |
01.06.2026 09:50:04
200 10.06.2026 23:20:12 23 |
01.01.2026 00:00:08
200 05.04.2026 06:50:00 13 |
09.10.2023 22:53:15
200 02.08.2025 21:10:00 9 |
cb |
| Soil Moisture2 |
00:00:08
200 02:20:00 55 |
00:00:09 (Montag)
200 02:20:00 (Mittwoch) 55 |
01.06.2026 10:25:05
200 01.06.2026 04:02:43 24 |
01.01.2026 00:00:08
200 07.05.2026 02:10:09 14 |
10.10.2023 05:53:15
200 29.08.2025 20:30:00 9 |
cb |
| Soil Moisture3 |
01:50:11
10 00:00:08 10 |
01:50:11 (Mittwoch)
10 00:00:09 (Montag) 9 |
02.06.2026 22:32:44
45 14.06.2026 06:25:09 8 |
02.06.2026 22:32:44
45 14.06.2026 06:25:09 8 |
09.09.2024 04:50:00
58 06.06.2024 23:50:00 7 |
cb |
| Soil Moisture4 |
00:00:08
200 00:00:08 200 |
00:00:09 (Montag)
200 00:00:09 (Montag) 200 |
01.06.2026 00:00:03
200 03.06.2026 01:00:09 74 |
01.01.2026 00:00:08
200 11.05.2026 20:55:10 58 |
09.10.2023 19:15:25
200 09.09.2024 07:15:00 44 |
cb |
| Temperature +10cm |
00:55:04
12,5 00:00:08 11,5 |
15:35:06 (Montag)
27,4 04:10:02 (Montag) 5,7 |
08.06.2026 15:30:12
38,1 12.06.2026 00:00:10 4,6 |
26.05.2026 16:12:44
39,9 23.01.2026 02:55:08 -14,9 |
13.08.2024 16:50:00
45,6 23.01.2026 02:55:08 -14,9 |
°C |
| Precipitation detection |
01:00:06
82,2 00:00:08 62,3 |
17:00:11 (Dienstag)
82,2 00:00:09 (Montag) 62,3 |
01.06.2026 01:50:05
82,2 01.06.2026 00:00:03 62,3 |
01.01.2026 00:00:08
82,2 01.01.2026 01:15:06 62,3 |
09.10.2023 22:58:15
82,2 09.10.2023 19:15:25 62,3 |
°C |
| Leaf Wetness1 |
01:30:05
15 00:05:10 0 |
01:30:05 (Mittwoch)
15 00:00:09 (Montag) 0 |
01.06.2026 00:00:03
15 01.06.2026 18:05:10 0 |
09.01.2026 14:20:12
15 01.01.2026 12:50:12 0 |
09.10.2023 19:15:25
15 10.10.2023 09:28:15 0 |
|
| Leaf Wetness2 |
00:55:04
15 00:00:08 0 |
16:50:08 (Dienstag)
15 00:00:09 (Montag) 0 |
01.06.2026 00:00:03
15 01.06.2026 17:05:12 0 |
09.01.2026 14:15:10
15 06.01.2026 12:55:08 0 |
09.10.2023 19:15:25
15 10.10.2023 08:53:15 0 |
|
| - - - - - - - - - - - - - - - - - - - - - | ||||||
| Data VUE | ||||||
| Outside Temp VUE |
01:00:06
12,3 00:05:00 11,6 |
14:05:08 (Dienstag)
19,3 04:35:10 (Montag) 5,7 |
08.06.2026 15:05:00
24,3 12.06.2026 00:20:06 4,2 |
26.05.2026 15:20:08
28,1 23.01.2026 04:20:09 -15,1 |
02.07.2025 15:30:00
31,4 23.01.2026 04:20:09 -15,1 |
°C |
| Outside Temp VUE | ø 12,0 | ø 12,6 | ø 12,9 | ø 5,3 | ø 7,4 | °C |
| Outside Hum VUE |
00:00:08
80 01:35:06 74 |
02:20:10 (Montag)
84 16:20:07 (Montag) 52 |
15.06.2026 02:20:10
84 08.06.2026 11:50:07 39 |
11.01.2026 22:35:09
86 19.01.2026 11:35:06 17 |
20.01.2024 08:25:00
87 27.12.2024 11:40:00 15 |
% |
| Heat Index VUE |
00:55:04
12,1 00:00:08 11,4 |
14:35:07 (Dienstag)
18,9 04:40:00 (Montag) 5,6 |
08.06.2026 15:00:03
24,1 12.06.2026 00:20:06 3,9 |
26.05.2026 15:20:08
27,9 23.01.2026 04:20:09 -15,1 |
14.08.2025 15:30:00
32,8 23.01.2026 04:20:09 -15,1 |
°C |
| Wind Chill VUE |
01:00:06
12,3 00:05:00 11,6 |
14:05:08 (Dienstag)
19,3 04:35:10 (Montag) 5,7 |
08.06.2026 15:05:00
24,3 11.06.2026 17:32:51 3,1 |
26.05.2026 15:20:08
28,1 08.01.2026 01:30:03 -17,7 |
02.07.2025 15:30:00
31,4 08.01.2024 22:50:00 -18,5 |
°C |
| Dew Point VUE |
N/A
N/A N/A N/A |
N/A
N/A N/A N/A |
N/A
N/A N/A N/A |
12.02.2026 13:32:44
4,4 19.01.2026 07:50:04 -18,3 |
10.07.2024 11:35:00
21,9 19.01.2026 07:50:04 -18,3 |
°C |
| Wetbulb VUE |
00:50:03
10,3 02:15:08 9,5 |
14:35:07 (Dienstag)
14,8 04:25:07 (Montag) 4,4 |
08.06.2026 14:40:07
17,0 11.06.2026 22:50:09 2,5 |
25.05.2026 18:05:04
19,6 23.01.2026 04:20:09 -15,5 |
21.06.2024 13:35:00
23,4 23.01.2026 04:20:09 -15,5 |
°C |
| THW Index VUE |
00:55:04
12,1 00:00:08 11,4 |
14:35:07 (Dienstag)
18,9 04:40:00 (Montag) 5,6 |
08.06.2026 15:00:03
24,1 11.06.2026 17:32:51 2,9 |
26.05.2026 15:20:08
27,9 08.01.2026 01:30:03 -17,7 |
14.08.2025 15:30:00
32,8 08.01.2024 22:50:00 -18,6 |
°C |
| Wind Speed VUE |
00:00:08
0,0 00:00:08 0,0 |
16:14:15 (Montag)
24,3 00:00:09 (Montag) 0,0 |
13.06.2026 15:10:12
32,9 01.06.2026 02:47:51 0,0 |
15.02.2026 00:05:12
44,3 01.01.2026 00:00:08 0,0 |
24.12.2025 12:20:07
64,4 10.10.2023 00:48:15 0,0 |
km/h |
| Gust Speed VUE |
01:10:09
1,4 00:00:08 0,0 |
13:47:44 (Montag)
46,7 00:00:09 (Montag) 0,0 |
13.06.2026 14:10:04
51,8 01.06.2026 09:47:43 0,0 |
19.02.2026 16:02:44
58,8 01.01.2026 13:15:12 0,0 |
24.12.2025 14:05:12
66,0 10.10.2023 01:38:15 0,0 |
km/h |
| Rain VUE |
01:40:08
0,2 00:00:08 0,0 |
01:40:08 (Mittwoch)
0,2 00:00:09 (Montag) 0,0 |
11.06.2026 17:25:09
2,8 01.06.2026 00:00:03 0,0 |
30.05.2026 17:03:33
4,0 01.01.2026 00:00:08 0,0 |
29.08.2025 20:35:00
15,0 22.10.2023 13:35:00 0,0 |
mm |
| Rain Rate VUE |
01:40:08
1,8 00:00:08 0,0 |
01:40:08 (Mittwoch)
1,8 00:00:09 (Montag) 0,0 |
11.06.2026 17:20:08
42,2 01.06.2026 00:00:03 0,0 |
11.06.2026 17:20:08
42,2 01.01.2026 00:00:08 0,0 |
13.07.2024 23:10:00
134,0 09.10.2023 19:15:25 0,0 |
mm/h |
| Voltage | ||
|---|---|---|
| Console Battery | 4242 mV | |
| TX Battery Volt VUE | 2,810 V | |
| Supercap Volt VUE | 1,703 V | |
| Solar Panel Volt VUE | 0,595 V | |
| Battery Status | ||
| Console Battery | OK | |
| Transmitter Battery ISS | OK | |
| Transmitter Battery VUE | OK | |
| Transmitter Battery Leaf | OK | |
| Transmitter Battery Soil | OK | |
| Connectivity | ||
| Signal Strength | -37,0 dBm | |
| RX Status ISS | OK | |
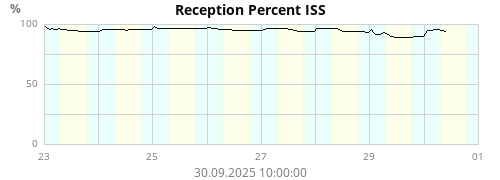
| Reception Percent ISS | 97% | |
| Rssi ISS | -73,0 dBm | |
| RX Status VUE | OK | |
| Reception Percent VUE | 87% | |
| Rssi VUE | -82,0 dBm | |
| RX Status Leaf | OK | |
| Reception Percent Leaf | 97% | |
| Rssi Leaf | -77,0 dBm | |
| RX Status Soil | OK | |
| Reception Percent Soil | 98% | |
| Rssi Soil | -75,0 dBm |
About this station
♦
| Hardware | DavisConsoleAPI |
| App Uptime | 7 days, 23:14:02 |
| Latitude | 48° 45.15' N |
| Longitude | 013° 49.13' E |
| Altitude | 828 meters |
| Server uptime | 133 days, 9 hours, 5 minutes |
| WeeWX uptime | 0 days, 15 hours, 19 minutes |
| WeeWX version | 5.3.1 |
| Skin | Season Davis Console 5.3.1 |

minimum Temperature
| °C | Jan | Feb | Mar | Apr | May | Jun | Jul | Aug | Sep | Oct | Nov | Dec | Min |
|---|---|---|---|---|---|---|---|---|---|---|---|---|---|
| 2023 | - | - | - | - | - | - | - | - | - | -2.0 | -5.8 | -10.9 | -10.9 |
| 2024 | -9.1 | -2.2 | -1.4 | -2.3 | 4.8 | 6.2 | 8.4 | 9.4 | 1.3 | 0.1 | -4.2 | -6.8 | -9.1 |
| 2025 | -9.2 | -9.7 | -7.8 | -4.9 | 0.6 | 5.9 | 7.9 | 4.9 | 2.9 | -0.9 | -11.4 | -11.3 | -11.4 |
| 2026 | -14.4 | -7.3 | -4.7 | -2.3 | -1.6 | 5.3 | - | - | - | - | - | - | -14.4 |
average Temperature
| °C | Jan | Feb | Mar | Apr | May | Jun | Jul | Aug | Sep | Oct | Nov | Dec | ø |
|---|---|---|---|---|---|---|---|---|---|---|---|---|---|
| 2023 | - | - | - | - | - | - | - | - | - | 10.0 | 2.3 | 0.8 | 3.7 |
| 2024 | -1.0 | 3.9 | 5.7 | 8.0 | 12.8 | 16.2 | 18.0 | 19.2 | 13.6 | 9.5 | 1.8 | 0.1 | 9.0 |
| 2025 | 0.4 | -0.7 | 4.7 | 9.3 | 10.0 | 17.2 | 16.0 | 16.8 | 12.9 | 6.5 | 2.5 | 0.7 | 8.0 |
| 2026 | -3.0 | 1.4 | 4.4 | 7.4 | 12.8 | 13.4 | - | - | - | - | - | - | 5.5 |
maximum Temperature
| °C | Jan | Feb | Mar | Apr | May | Jun | Jul | Aug | Sep | Oct | Nov | Dec | Max |
|---|---|---|---|---|---|---|---|---|---|---|---|---|---|
| 2023 | - | - | - | - | - | - | - | - | - | 21.2 | 14.4 | 9.0 | 21.2 |
| 2024 | 10.1 | 14.2 | 18.6 | 24.3 | 21.4 | 29.8 | 28.4 | 30.9 | 28.8 | 23.4 | 12.9 | 10.3 | 30.9 |
| 2025 | 14.4 | 11.6 | 17.3 | 22.5 | 24.9 | 29.4 | 31.1 | 30.6 | 27.1 | 15.7 | 17.3 | 12.8 | 31.1 |
| 2026 | 7.7 | 15.5 | 14.6 | 19.1 | 28.0 | 24.1 | - | - | - | - | - | - | 28.0 |
Rain
| mm | Jan | Feb | Mar | Apr | May | Jun | Jul | Aug | Sep | Oct | Nov | Dec | Total |
|---|---|---|---|---|---|---|---|---|---|---|---|---|---|
| 2023 | - | - | - | - | - | - | - | 0.0 | 0.0 | 26.4 | 216.4 | 233.6 | 476.4 |
| 2024 | 139.6 | 101.6 | 40.8 | 85.2 | 147.8 | 118.2 | 88.2 | 64.2 | 317.8 | 75.4 | 88.0 | 96.8 | 1363.6 |
| 2025 | 75.4 | 23.0 | 41.8 | 47.6 | 69.4 | 79.4 | 154.6 | 78.6 | 85.6 | 134.8 | 53.0 | 15.8 | 859.0 |
| 2026 | 45.4 | 139.2 | 27.8 | 15.8 | 55.8 | 117.6 | - | - | - | - | - | - | 401.6 |
Rain Days
| Tage | Jan | Feb | Mar | Apr | May | Jun | Jul | Aug | Sep | Oct | Nov | Dec | Tage |
|---|---|---|---|---|---|---|---|---|---|---|---|---|---|
| 2023 | - | - | - | - | - | - | - | 0 | 0 | 8 | 27 | 23 | 58 |
| 2024 | 15 | 18 | 12 | 15 | 17 | 20 | 17 | 11 | 13 | 20 | 11 | 18 | 187 |
| 2025 | 15 | 6 | 12 | 6 | 9 | 12 | 20 | 11 | 14 | 16 | 15 | 11 | 147 |
| 2026 | 10 | 14 | 10 | 7 | 12 | 12 | - | - | - | - | - | - | 65 |
Windgust
| km/h | Jan | Feb | Mar | Apr | May | Jun | Jul | Aug | Sep | Oct | Nov | Dec | Max |
|---|---|---|---|---|---|---|---|---|---|---|---|---|---|
| 2023 | - | - | - | - | - | - | - | - | - | 33.8 | 43.5 | 57.9 | 57.9 |
| 2024 | 53.1 | 41.8 | 41.8 | 51.5 | 49.9 | 38.6 | 61.2 | 38.6 | 46.7 | 40.2 | 35.4 | 35.4 | 61.2 |
| 2025 | 38.6 | 56.3 | 56.3 | 53.1 | 45.1 | 95.0 | 35.4 | 45.1 | 61.2 | 43.5 | 46.7 | 59.5 | 95.0 |
| 2026 | 48.3 | 56.3 | 43.5 | 48.3 | 40.2 | 45.1 | - | - | - | - | - | - | 56.3 |
Highest UV index
| Jan | Feb | Mar | Apr | May | Jun | Jul | Aug | Sep | Oct | Nov | Dec | Max | |
|---|---|---|---|---|---|---|---|---|---|---|---|---|---|
| 2023 | - | - | - | - | - | - | - | - | - | 3.1 | 1.6 | 0.9 | 3.1 |
| 2024 | 1.0 | 1.8 | 4.2 | 6.1 | 7.8 | 8.7 | 8.7 | 8.0 | 6.0 | 3.3 | 1.9 | 0.9 | 8.7 |
| 2025 | 1.2 | 1.9 | 4.2 | 6.4 | 8.8 | 9.9 | 8.9 | 9.2 | 6.5 | 3.3 | 2.1 | 0.8 | 9.9 |
| 2026 | 1.1 | 2.1 | 3.5 | 5.3 | 8.0 | 8.8 | - | - | - | - | - | - | 8.8 |
Maximum Solar radiation
| W/m² | Jan | Feb | Mar | Apr | May | Jun | Jul | Aug | Sep | Oct | Nov | Dec | Max |
|---|---|---|---|---|---|---|---|---|---|---|---|---|---|
| 2023 | - | - | - | - | - | - | - | - | - | 684 | 610 | 439 | 684 |
| 2024 | 517 | 679 | 1009 | 1125 | 1216 | 1174 | 1215 | 1100 | 1007 | 840 | 635 | 503 | 1216 |
| 2025 | 559 | 784 | 1039 | 1158 | 1290 | 1225 | 1208 | 1167 | 995 | 810 | 478 | 415 | 1290 |
| 2026 | 533 | 789 | 1011 | 998 | 1201 | 1266 | - | - | - | - | - | - | 1266 |
Lowest Barometer
| hPa | Jan | Feb | Mar | Apr | May | Jun | Jul | Aug | Sep | Oct | Nov | Dec | Min |
|---|---|---|---|---|---|---|---|---|---|---|---|---|---|
| 2023 | - | - | - | - | - | - | - | - | - | 981 | 980 | 986 | 980 |
| 2024 | 984 | 982 | 982 | 990 | 997 | 1001 | 1003 | 1004 | 998 | 989 | 983 | 1000 | 982 |
| 2025 | 995 | 1012 | 992 | 1000 | 1007 | 1009 | 1005 | 1004 | 1008 | 990 | 997 | 1003 | 990 |
| 2026 | 987 | 981 | 997 | 1008 | 997 | 1007 | - | - | - | - | - | - | 981 |
average Barometer
| hPa | Jan | Feb | Mar | Apr | May | Jun | Jul | Aug | Sep | Oct | Nov | Dec | ø |
|---|---|---|---|---|---|---|---|---|---|---|---|---|---|
| 2023 | - | - | - | - | - | - | - | - | - | 1004 | 1003 | 1009 | 1005 |
| 2024 | 1012 | 1008 | 1004 | 1010 | 1009 | 1011 | 1013 | 1013 | 1011 | 1013 | 1015 | 1021 | 1012 |
| 2025 | 1017 | 1023 | 1016 | 1015 | 1015 | 1020 | 1015 | 1017 | 1018 | 1015 | 1013 | 1017 | 1017 |
| 2026 | 1005 | 1005 | 1017 | 1018 | 1016 | 1016 | - | - | - | - | - | - | 1013 |
Highest Barometer
| hPa | Jan | Feb | Mar | Apr | May | Jun | Jul | Aug | Sep | Oct | Nov | Dec | Max |
|---|---|---|---|---|---|---|---|---|---|---|---|---|---|
| 2023 | - | - | - | - | - | - | - | - | - | 1019 | 1020 | 1035 | 1035 |
| 2024 | 1031 | 1028 | 1018 | 1029 | 1020 | 1018 | 1022 | 1020 | 1023 | 1028 | 1026 | 1037 | 1037 |
| 2025 | 1039 | 1037 | 1032 | 1026 | 1023 | 1027 | 1026 | 1027 | 1029 | 1032 | 1025 | 1027 | 1039 |
| 2026 | 1021 | 1024 | 1025 | 1028 | 1032 | 1024 | - | - | - | - | - | - | 1032 |
Number of Summer Days (maximum Temperature ≥25°C)
| Days | Jan | Feb | Mar | Apr | May | Jun | Jul | Aug | Sep | Oct | Nov | Dec | max≥25 |
|---|---|---|---|---|---|---|---|---|---|---|---|---|---|
| 2023 | - | - | - | - | - | - | - | 0 | 0 | 0 | 0 | 0 | 0 |
| 2024 | 0 | 0 | 0 | 0 | 0 | 7 | 12 | 15 | 7 | 0 | 0 | 0 | 41 |
| 2025 | 0 | 0 | 0 | 0 | 0 | 10 | 5 | 10 | 2 | 0 | 0 | 0 | 27 |
| 2026 | 0 | 0 | 0 | 0 | 5 | 0 | - | - | - | - | - | - | 5 |
Number of Warm days (maximum Temperature ≥20°C)
| Days | Jan | Feb | Mar | Apr | May | Jun | Jul | Aug | Sep | Oct | Nov | Dec | max≥20 |
|---|---|---|---|---|---|---|---|---|---|---|---|---|---|
| 2023 | - | - | - | - | - | - | - | 0 | 0 | 3 | 0 | 0 | 3 |
| 2024 | 0 | 0 | 0 | 7 | 6 | 18 | 26 | 29 | 11 | 2 | 0 | 0 | 99 |
| 2025 | 0 | 0 | 0 | 5 | 3 | 22 | 14 | 20 | 9 | 0 | 0 | 0 | 73 |
| 2026 | 0 | 0 | 0 | 0 | 15 | 4 | - | - | - | - | - | - | 19 |
Number of days (minimum Temperature ≥17°C)
| Days | Jan | Feb | Mar | Apr | May | Jun | Jul | Aug | Sep | Oct | Nov | Dec | min≥17 |
|---|---|---|---|---|---|---|---|---|---|---|---|---|---|
| 2023 | - | - | - | - | - | - | - | 0 | 0 | 0 | 0 | 0 | 0 |
| 2024 | 0 | 0 | 0 | 0 | 0 | 0 | 3 | 2 | 2 | 0 | 0 | 0 | 7 |
| 2025 | 0 | 0 | 0 | 0 | 0 | 1 | 0 | 4 | 0 | 0 | 0 | 0 | 5 |
| 2026 | 0 | 0 | 0 | 0 | 0 | 0 | - | - | - | - | - | - | 0 |
Vegetation days (average Temperature ≥5°C)
| Days | Jan | Feb | Mar | Apr | May | Jun | Jul | Aug | Sep | Oct | Nov | Dec | ø≥5 |
|---|---|---|---|---|---|---|---|---|---|---|---|---|---|
| 2023 | - | - | - | - | - | - | - | - | - | 20 | 8 | 0 | 28 |
| 2024 | 0 | 8 | 20 | 20 | 31 | 30 | 31 | 31 | 29 | 31 | 6 | 0 | 237 |
| 2025 | 3 | 1 | 18 | 25 | 30 | 30 | 29 | 31 | 30 | 24 | 11 | 4 | 236 |
| 2026 | 0 | 3 | 16 | 23 | 29 | 17 | - | - | - | - | - | - | 88 |
Heating Days (average Temperature ≤ 12 °C)
| Tage | Jan | Feb | Mar | Apr | May | Jun | Jul | Aug | Sep | Oct | Nov | Dec | ø≤12 |
|---|---|---|---|---|---|---|---|---|---|---|---|---|---|
| 2023 | - | - | - | - | - | - | - | - | - | 15 | 30 | 31 | 76 |
| 2024 | 31 | 29 | 29 | 21 | 11 | 4 | 2 | 0 | 10 | 27 | 30 | 31 | 225 |
| 2025 | 31 | 28 | 31 | 21 | 24 | 2 | 2 | 3 | 11 | 31 | 30 | 31 | 245 |
| 2026 | 31 | 28 | 31 | 30 | 14 | 4 | - | - | - | - | - | - | 138 |
Number of Frost days (minimum Temperature ≤0°C)
| Days | Jan | Feb | Mar | Apr | May | Jun | Jul | Aug | Sep | Oct | Nov | Dec | min≤0 |
|---|---|---|---|---|---|---|---|---|---|---|---|---|---|
| 2023 | - | - | - | - | - | - | - | 0 | 0 | 1 | 13 | 17 | 31 |
| 2024 | 20 | 8 | 7 | 10 | 0 | 0 | 0 | 0 | 0 | 0 | 17 | 26 | 88 |
| 2025 | 24 | 24 | 10 | 4 | 0 | 0 | 0 | 0 | 0 | 3 | 15 | 23 | 103 |
| 2026 | 27 | 19 | 11 | 8 | 1 | 0 | - | - | - | - | - | - | 66 |
Number of Ice days (maximum Temperature ≤0°C)
| Days | Jan | Feb | Mar | Apr | May | Jun | Jul | Aug | Sep | Oct | Nov | Dec | max≤0 |
|---|---|---|---|---|---|---|---|---|---|---|---|---|---|
| 2023 | - | - | - | - | - | - | - | 0 | 0 | 0 | 4 | 4 | 8 |
| 2024 | 10 | 0 | 0 | 0 | 0 | 0 | 0 | 0 | 0 | 0 | 5 | 4 | 19 |
| 2025 | 7 | 8 | 1 | 0 | 0 | 0 | 0 | 0 | 0 | 0 | 8 | 6 | 30 |
| 2026 | 14 | 4 | 0 | 0 | 0 | 0 | - | - | - | - | - | - | 18 |
Sunshine Duration
| Hours | Jan | Feb | Mar | Apr | May | Jun | Jul | Aug | Sep | Oct | Nov | Dec | Total |
|---|---|---|---|---|---|---|---|---|---|---|---|---|---|
| 2023 | - | - | - | - | - | - | - | 0.0 | 0.0 | 25.0 | 49.3 | 41.0 | 115.2 |
| 2024 | 58.8 | 49.2 | 118.9 | 162.9 | 168.5 | 177.3 | 169.8 | 240.7 | 155.5 | 128.8 | 68.6 | 80.2 | 1579.2 |
| 2025 | 82.8 | 120.8 | 165.4 | 201.6 | 186.7 | 232.5 | 121.6 | 235.7 | 141.9 | 60.4 | 90.2 | 103.4 | 1742.8 |
| 2026 | 100.5 | 81.6 | 170.5 | 199.1 | 226.2 | 89.0 | - | - | - | - | - | - | 866.9 |
Precipitation Duration
| Hours | Jan | Feb | Mar | Apr | May | Jun | Jul | Aug | Sep | Oct | Nov | Dec | Total |
|---|---|---|---|---|---|---|---|---|---|---|---|---|---|
| 2023 | - | - | - | - | - | - | - | 0.0 | 0.0 | 9.8 | 73.8 | 80.3 | 163.9 |
| 2024 | 47.8 | 40.6 | 14.2 | 31.2 | 33.7 | 25.8 | 19.6 | 11.8 | 84.5 | 21.9 | 33.4 | 34.8 | 399.2 |
| 2025 | 28.1 | 9.1 | 15.0 | 16.8 | 20.9 | 14.6 | 32.5 | 13.5 | 22.9 | 43.2 | 20.1 | 6.5 | 243.2 |
| 2026 | 18.8 | 51.7 | 10.0 | 5.2 | 16.0 | 31.2 | - | - | - | - | - | - | 132.8 |
Heat Degree Days 18°C
| °C-day | Jan | Feb | Mar | Apr | May | Jun | Jul | Aug | Sep | Oct | Nov | Dec | Gesamt |
|---|---|---|---|---|---|---|---|---|---|---|---|---|---|
| 2023 | 0.0 | 0.0 | 0.0 | 0.0 | 0.0 | 0.0 | 0.0 | 0.0 | 0.0 | 190.6 | 479.0 | 544.4 | 1214.0 |
| 2024 | 599.9 | 418.3 | 391.4 | 310.2 | 171.6 | 85.5 | 41.9 | 23.9 | 165.0 | 272.4 | 494.8 | 565.3 | 3540.3 |
| 2025 | 556.5 | 534.0 | 421.1 | 271.6 | 258.7 | 53.5 | 83.9 | 72.5 | 162.8 | 366.0 | 475.7 | 547.7 | 3804.2 |
| 2026 | 660.9 | 475.1 | 432.9 | 327.2 | 177.8 | 84.6 | 0.0 | 0.0 | 0.0 | 0.0 | 0.0 | 0.0 | 2158.5 |
Cool Degree Days 18°C
| °C-day | Jan | Feb | Mar | Apr | May | Jun | Jul | Aug | Sep | Oct | Nov | Dec | Gesamt |
|---|---|---|---|---|---|---|---|---|---|---|---|---|---|
| 2023 | 0.0 | 0.0 | 0.0 | 0.0 | 0.0 | 0.0 | 0.0 | 0.0 | 0.0 | 0.0 | 0.0 | 0.0 | 0.0 |
| 2024 | 0.0 | 0.0 | 0.0 | 0.0 | 0.0 | 21.7 | 33.5 | 50.5 | 21.9 | 0.0 | 0.0 | 0.0 | 127.6 |
| 2025 | 0.0 | 0.0 | 0.0 | 0.0 | 0.0 | 18.3 | 15.8 | 26.0 | 0.7 | 0.0 | 0.0 | 0.0 | 60.8 |
| 2026 | 0.0 | 0.0 | 0.0 | 0.0 | 7.7 | 0.0 | 0.0 | 0.0 | 0.0 | 0.0 | 0.0 | 0.0 | 7.7 |